


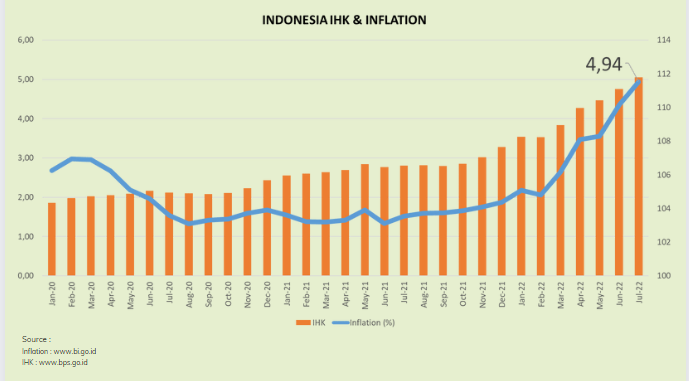
Recently, The prices of goods started to go up, not only for basic needs, but also fuel. These increased lead to Inflation. In simple term, it can be interpreted as an increase in the price of goods and services in general and continuously within a certain period. If we look at this graph, it is shown by inflation data in Indonesia which grown significantly in 2022, and July had the highest reached 4,94%
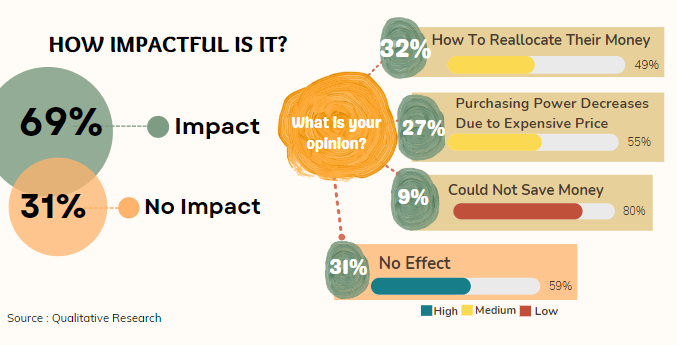
On July 2022, PT Global Loyalty Indonesia surveyed 108 respondents divided into three buying power levels, such as Low with 35 respondents, Medium with 38 respondents, and High with 35 respondents. Then, 69% of respondents said it impacted their lives. Like, 32% of people say that they have to reallocate their money and are dominated by the medium segmentation. Also, 27% of people experience a decrease in buying power, it was dominated by Medium. And, 9% (majority from Low Segmentation) of respondents answered that they could not save money. However, 31% of respondents said inflation has no impact, dominated by high segmentation.
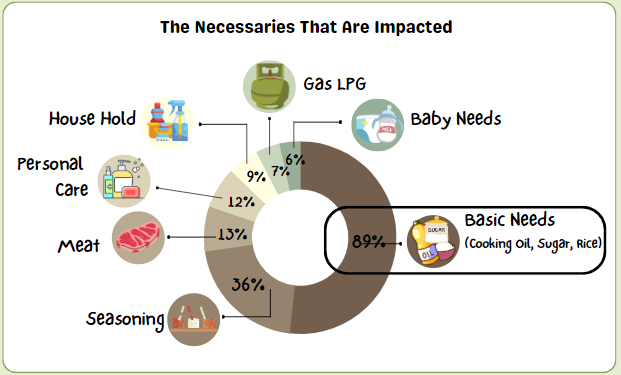
Furthermore, most of the respondents, around 89%, said that the increase in the price of basic needs category affected to their financial.
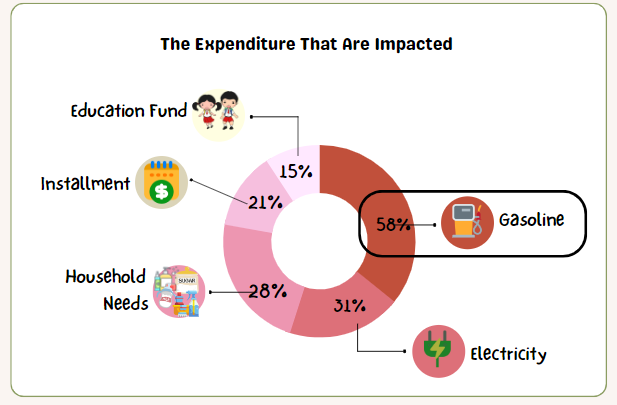
In addition, based on public expenditure, fuel oil is the expenses that have an impact with a percentage of 58%, then electricity at 31%, and household needs at 28%
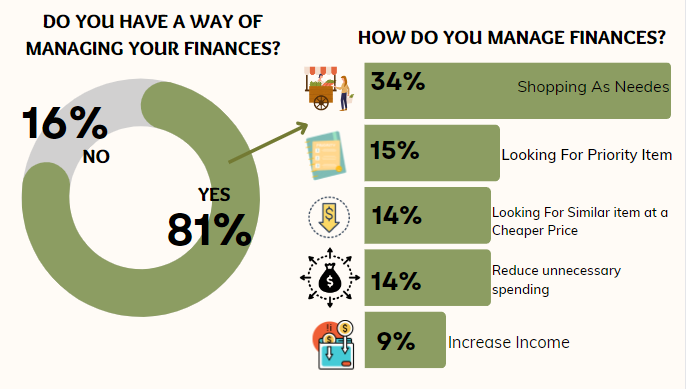
81% from the respondents have adapted with this condition. Several ways to adopt are, 34% shopping as needed, buying or looking for priority items only 15%, and looking for similar items at a cheaper price (14%)
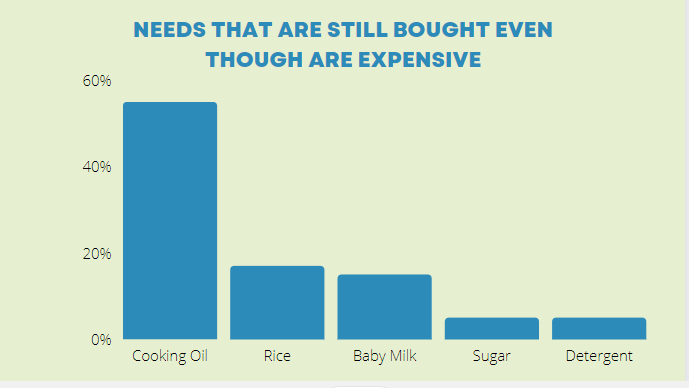
Although the prices are rising for several items, such as cooking oil, rice, baby milk, sugar, and detergent, they will be still bought by people. These items can be used as a way, to drive traffic to our store. Which means, it will become key items when inflation occurs
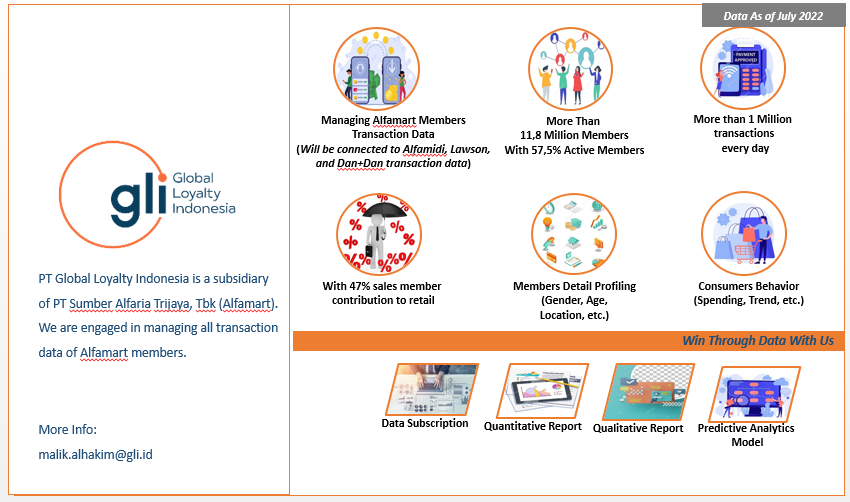
We hope these insights and data are beneficial for you. Suppose you want to know more about your product, we can help you because we have more than 11 million members with millions of daily transactions for analysis, such as consumer behavior and other product data.
Source:
https://www.bi.go.id/id/fungsi-utama/moneter/inflasi/Default.aspx
https://www.bi.go.id/id/statistik/indikator/data-inflasi.aspx
https://www.bps.go.id/statictable/2009/06/15/907/indeks-harga-konsumen-dan-inflasi-bulanan-indonesia-2006-2022.html